
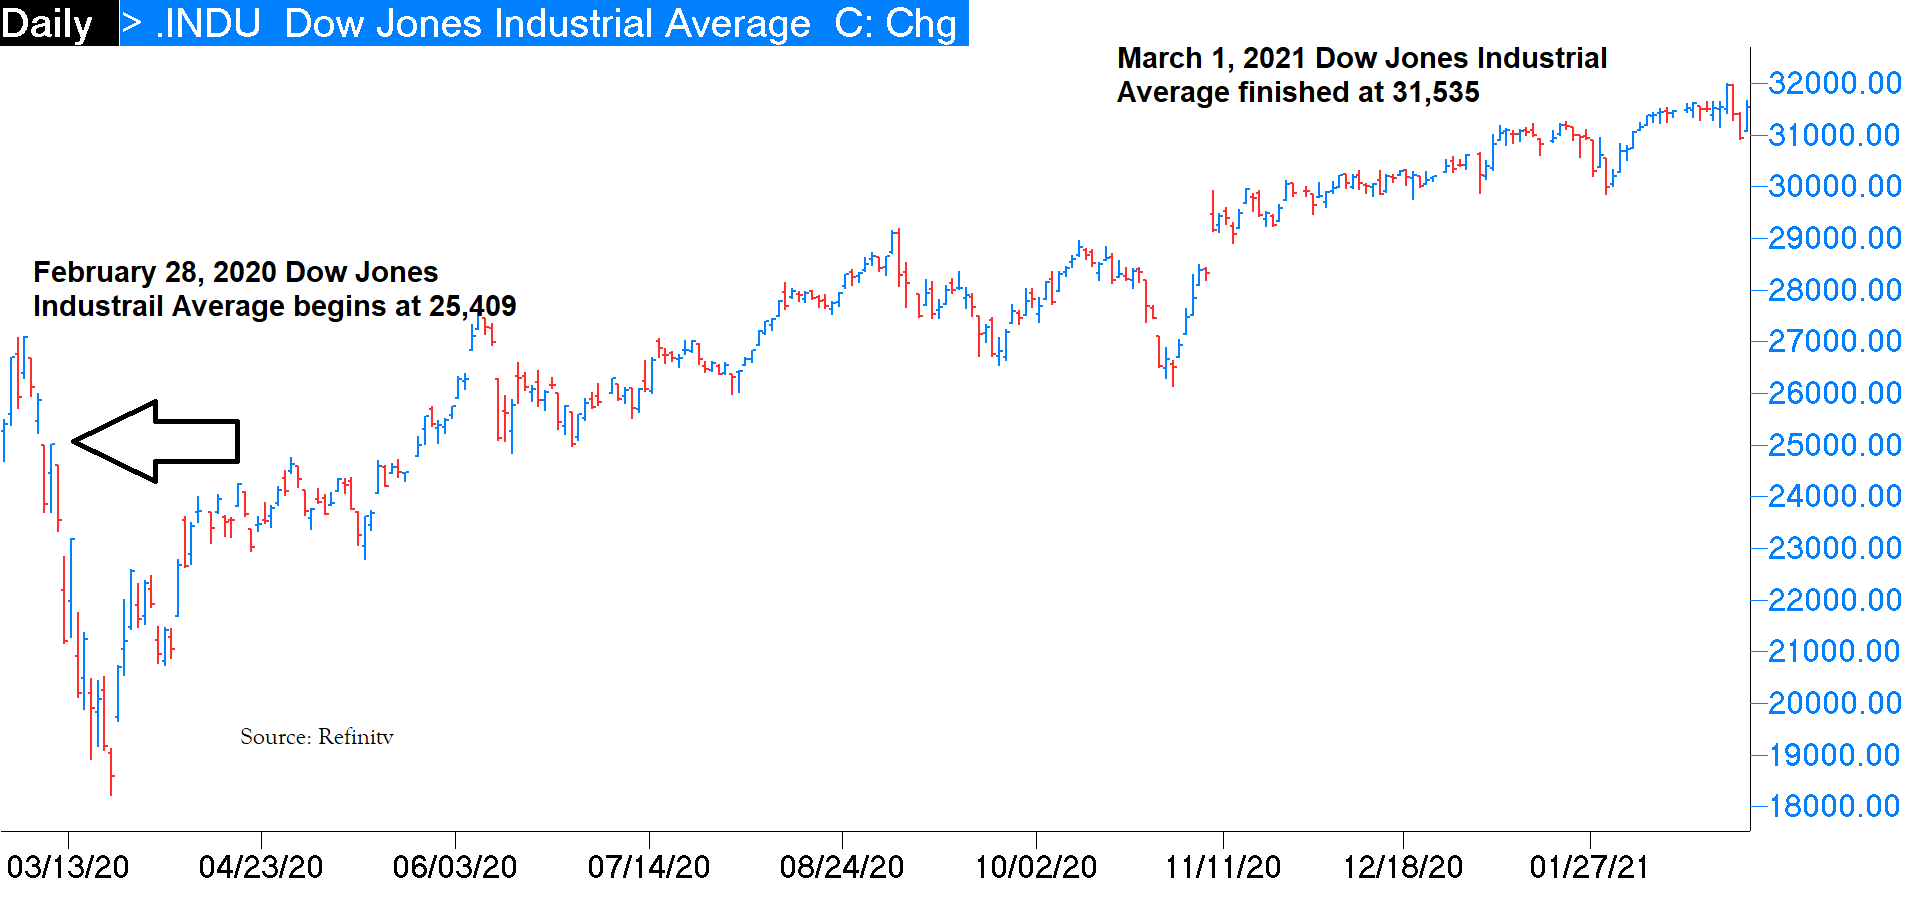
Last February we correctly estimated that the Dow Jones Industrial Average was severely undervalued and posted our forecast that the Dow would surge to about 31,451 by February 28, 2021. This year, February 28 fell on a Sunday and the next day, March 1st, the Dow Jones Industrial Average finished at 31,535. We don’t always get the number spot on like this but our process for determining potential upside has served us well over the years.

Where Could We Be Next Year and Why?
Let’s look at the facts first:
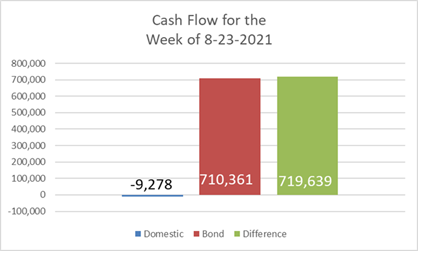
Investors of all sizes (including the government) are pouring even more money into bonds. Yes, bonds. I’m not sure why. In the past 12 months,$9.2 billion has come out of stocks and $710 billion has flowed into bonds.
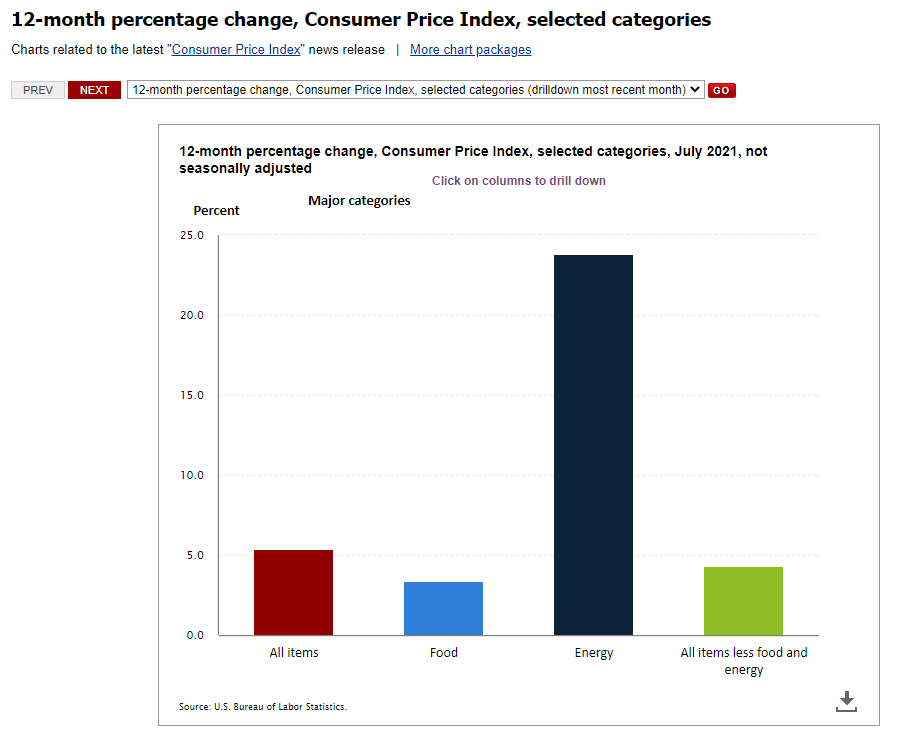
Today, the 10-year Treasury bond pays you 1.24%. After taxes and inflation, which is currently running at 5.4% (according to the U.S. Bureau of Labor Statistics) we believe an investor is certain to lose money by buying and holding bonds. In July, the Consumer Price Index for All Urban Consumers rose 0.5 percent on a seasonally adjusted basis; rising 5.4 percent over the last 12 months, not seasonally adjusted. The index for all items less food and energy increased 0.3 percent in July (SA); up 4.3 percent over the year (NSA).
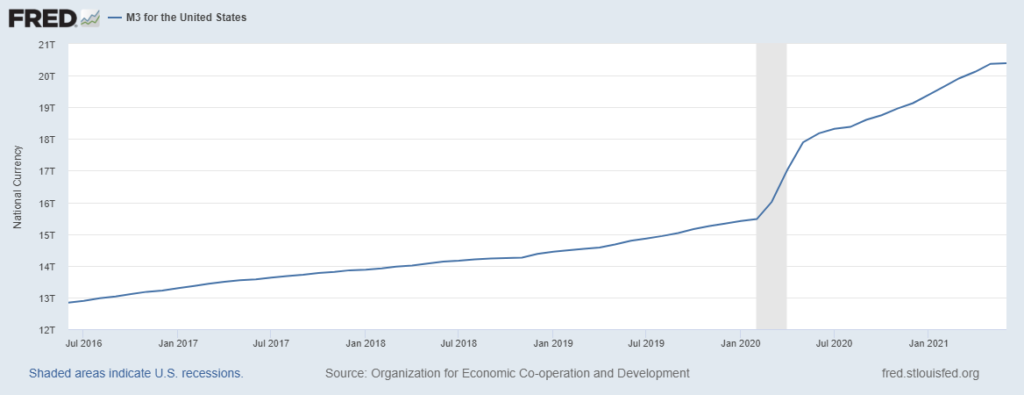
The Federal Reserve, in coordination with the Treasury, increased the money supply rapidly. In the past year, the money supply has increased from $15 trillion to $20 trillion – a 33% increase. When money floods into the economy, it tends to eventually find its way into financial assets like stocks and bonds. When the Fed cuts the supply of money, we will be concerned about asset prices falling.
Where Are We Today?
Based on the CNN Fear and Greed Index, it appears that Investors are neutral right now – neither terriby fearful nor greedy. The Fear and Greed index below is updated daily at CNN.com – (just google CNN Fear Greed).
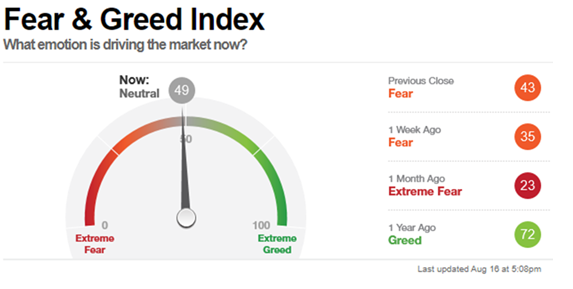
Source: CNN
Although no one can predict the future of the market, our analysis leads us to believe the DJIA could be around 38,910 this time next year – late August 2022. That does not mean it will be a smooth, straight ride to that point! We will likely have dips and bumps along the ride like always, but this is where our models suggest we are headed. Our Nasdaq 100 model currently indicates upside potential of 13% while our small cap model currently suggests the potential for a 34% increase 1 year from now. update: as of 9/4/21 the target is 26.5% because the small caps have increased from the 8/19/21 original write up.
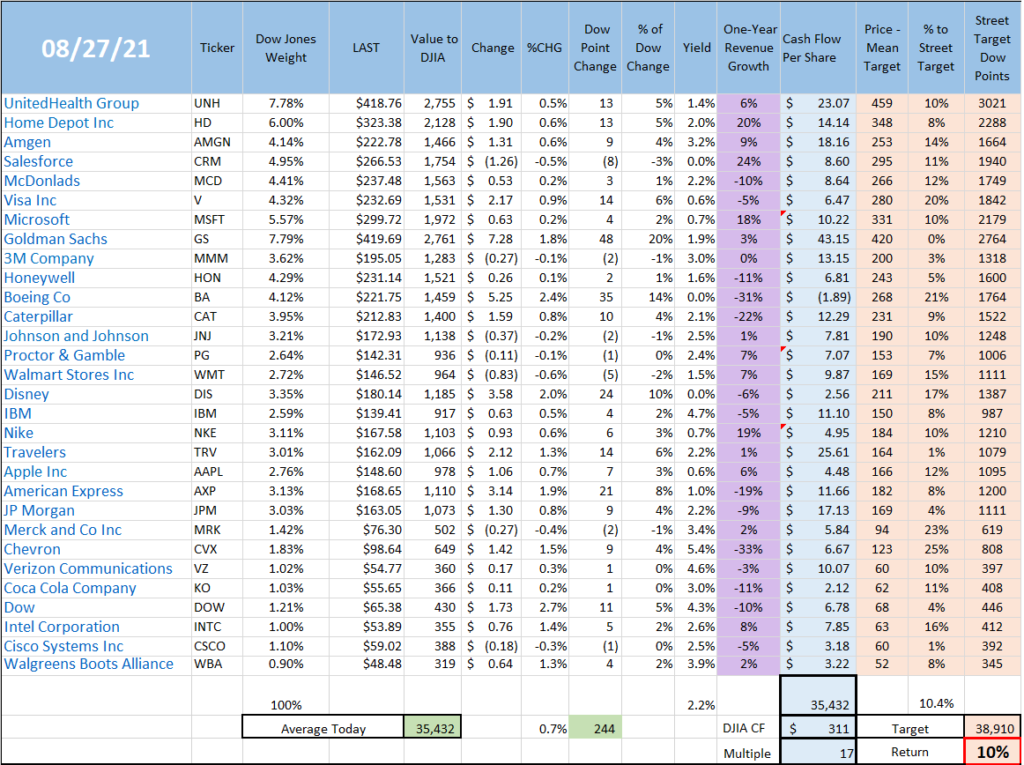
Source: Refintiv and US Asset Management
This material is intended for educational purposes and should not be construed as investment advice. The list shown here is not a “buy” list and is not meant as recommendations
What’s The Bottom Line?
Our position is that we think the broad market can drop 10% at any given moment. It happens. If the one-year estimated upside is around 10% but the market could drop 10% at any time, then it is probably best to wait for a dip to buy stocks in the Dow Jones Industrial Average. However, if you estimate that the upside in small company value stocks rise 34% a year from now, an investor might choose to have exposure to stocks in that group.
Critics will say that small company stocks are risky. We say all stocks are risky. We attempt to mitigate our risk by owning companies with strong balance sheets (lots of money in the bank and low debt). We like companies that produce lots of positive cash flow and can be bought for attractive prices.
- Right now, the 30 companies that make up the Dow Jones Industrial Average are selling for about 18 times cash flow. (Meaning: if you bought all of the companies in the Dow Jones Industrial Average and deposited the cash flow from each company to your bank account, it would take about 18 years for the cash flow to equal what you paid for all of the companies).
- The companies that make up the tech heavy NASDAQ index is selling for 33 times cash flow.
- The companies in the small company Russell 2000 value index are selling for about 14 times cash flow with many company stocks selling for much less.
Right now, I am reminded of March 2000 when the Nasdaq stocks climbed 20% from January 1 to about April 1st . Investors, it seemed were excited about companies that were involved in the internet. At the same time, small value style companies did nothing (think Toro lawnmowers, WD-40 Company, etc.) Then, from April 2000 to April 2002, the technology centric Nasdaq index dropped 85% while small value stocks went up. And they went up about 40% while tech stocks were dropping. This occurred because technology stocks were selling at the highest multiples to cash flow while small companies were selling at very low prices to cash flow. The chart below shows the relative performance of 3 indexes. We have a common starting point of January 1, 2000 for each of the indexes. The 3 lines below show the % gain or loss of each index over the time frame from Jan 1, 2000 to March 31, 2002. Technology stocks are the red line which declined 67%. The small company value stocks are the green line which increased 42% and the S&P 500 which represents the broad U.S. stocks market is the gray line and it declined 25%
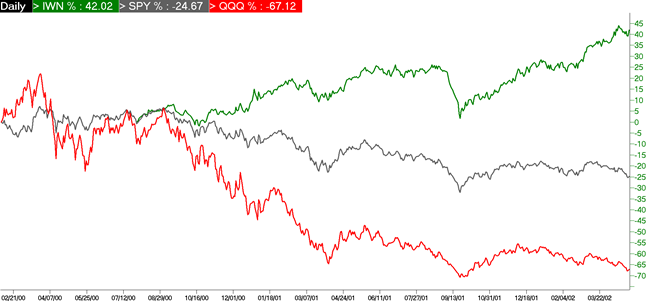
To my mind, we could have a potential repeat of 2000 coming. Big technology stocks are again selling at very high prices relative to the small value companies. However, just like in 2000, investors seem to be attracted to technology stocks while the best deals are in the small company area.
We think there are good opportunities, but they are concentrated in small companies you may never have heard of before. So, think small.
David Cross
p.s. If you have questions about the market or your investments, we invite your questions. Call us at 678-894-0696 or email us at david.cross@us-am.com
Disclosure: This material is intended for educational purposes and should not be construed as investment advice. This material is provided as a courtesy and for educational purposes only. Please consult your investment professional, legal or tax advisor for specific information pertaining to your situation. This material does not constitute a recommendation or a solicitation or offer of the purchase or sale of securities.
All information contained herein is derived from sources deemed to be reliable but cannot be guaranteed. All economic and performance data is historical and not indicative of future results. All views/opinions expressed in this newsletter are solely those of the author and do not reflect the views/opinions held by Advisory Services Network, LLC. The Standard & Poor’s 500 (S&P 500) is an unmanaged group of securities considered to be representative of the stock market in general. The term “Nasdaq” is also used to refer to the Nasdaq Composite, an index of more than 3,000 stocks listed on the Nasdaq exchange that includes the world’s foremost technology and biotech giants. The Dow Jones Industrial Average (DJIA) is a price-weighted index of 30 actively traded blue chip stocks. Indexes are unmanaged and do not incur management fees, costs, or expenses. It is not possible to invest directly in an index.

David.Cross@us-am.com