We continue to be long-term investors with an eye on where we think stock prices could be in 12 to 18 months, but during the COVID Crash of 2020 (can I call it that?), we felt it best to add a short-term timing element to our investment processes. After an exhaustive search of historic market price data, we found a correlation between tracking multiple short-term prices trends and intermediate-term price trends. What we found was simple: when the short-term moving averages on the graph in RED move below the 30-day exponential moving averages in BLUE, it is usually wise to cut back exposure to stocks significantly.
What we like to see is a red, white and blue pattern where the short term moving averages in RED are above the longer term moving averages in BLUE with some white in between. What we don’t want to see is the red lines dive into and below the blue lines. When that happens, we’ve seen a correlation to stocks declining.
S&P 500
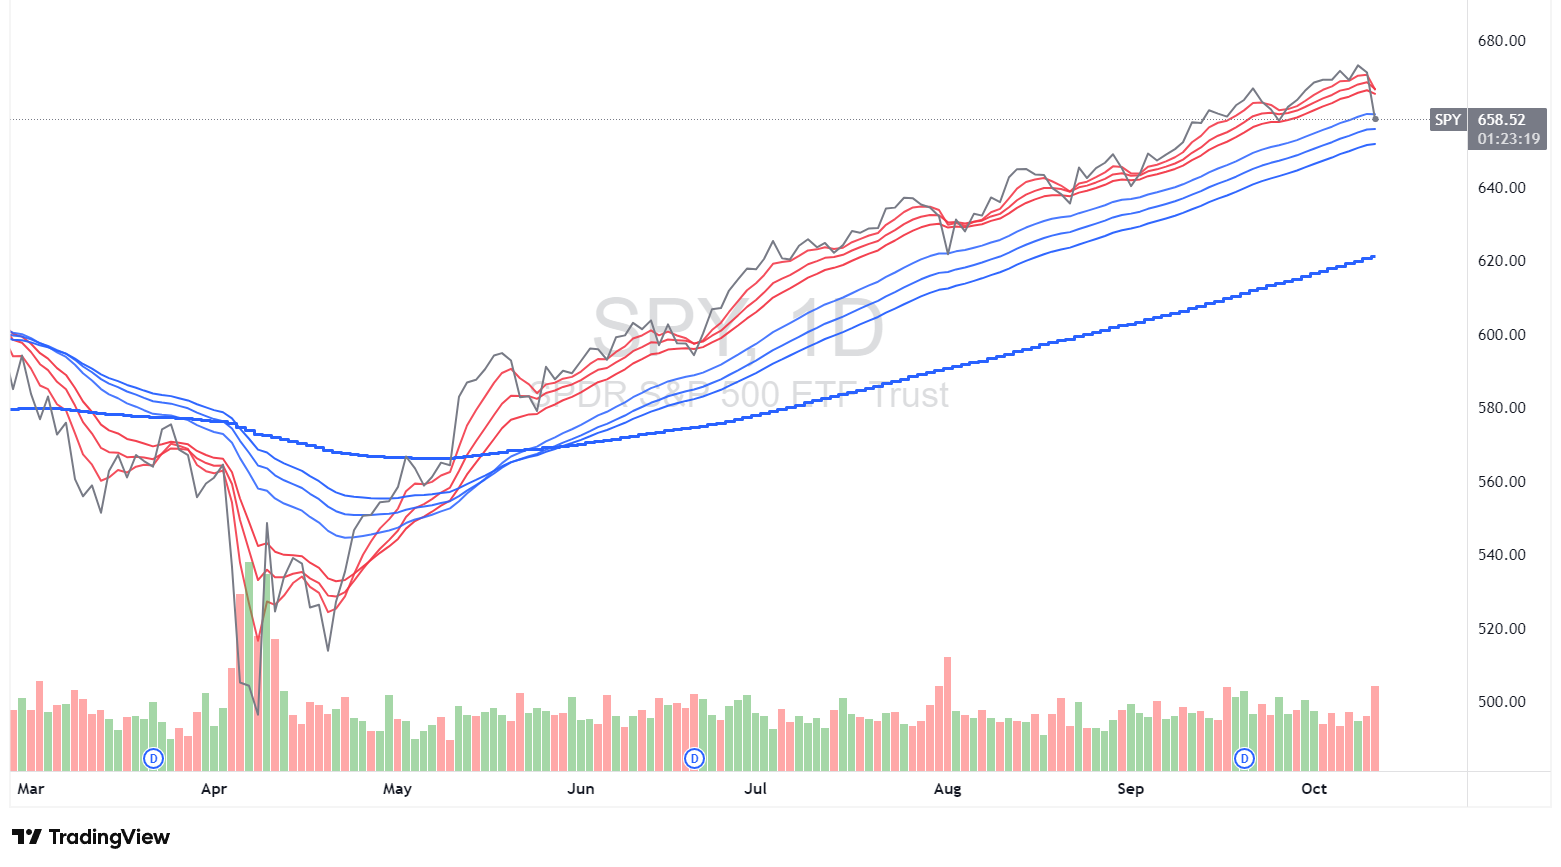
Source: TradingView
NASDAQ 100
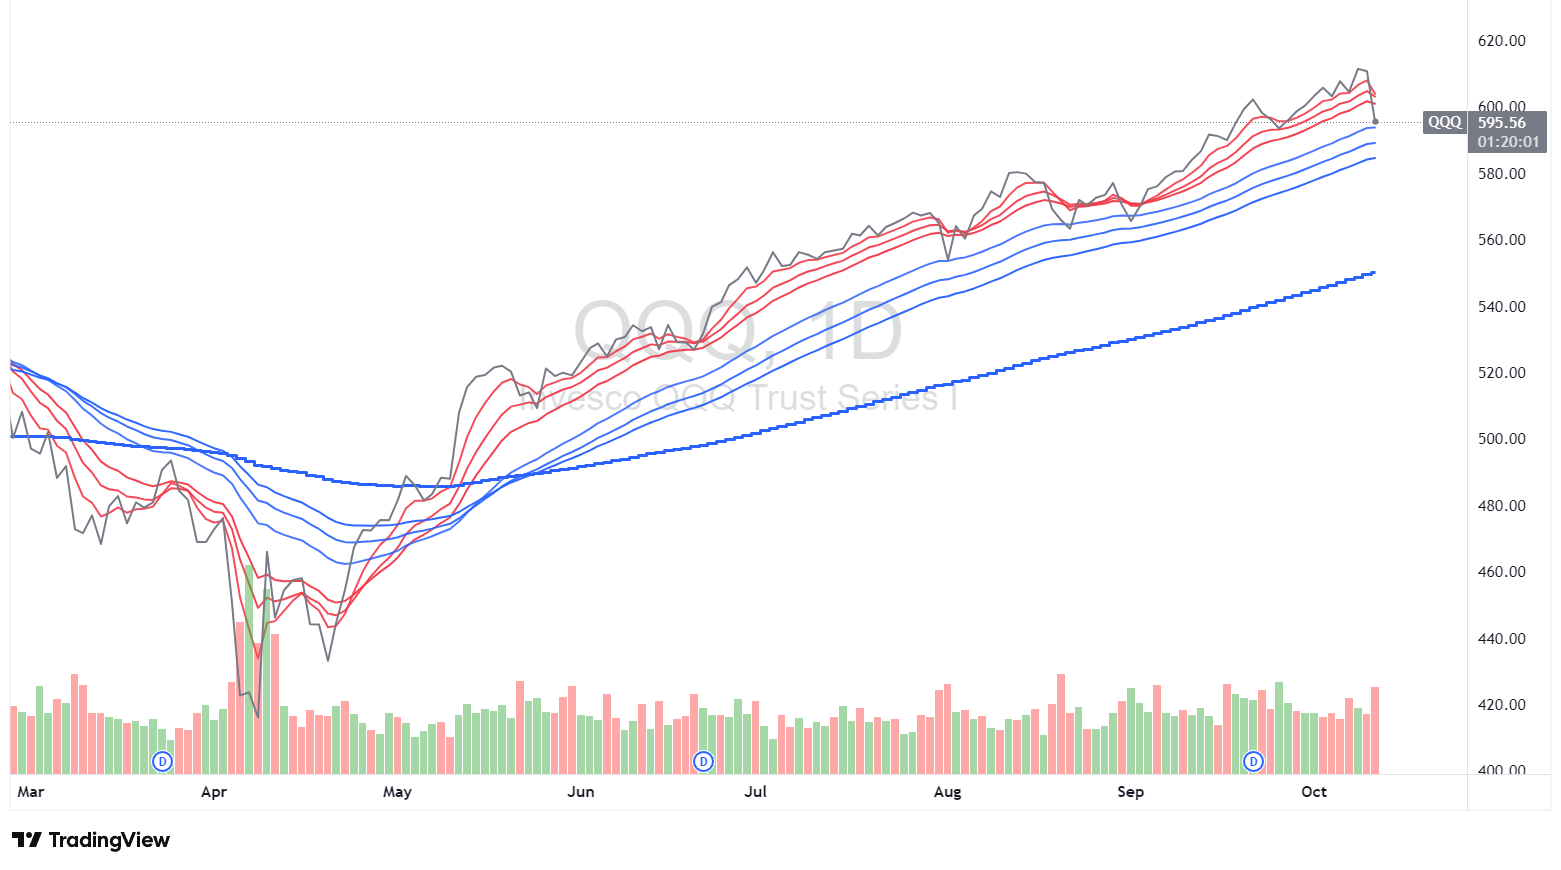
Source: TradingView
Russell 200 Small Caps
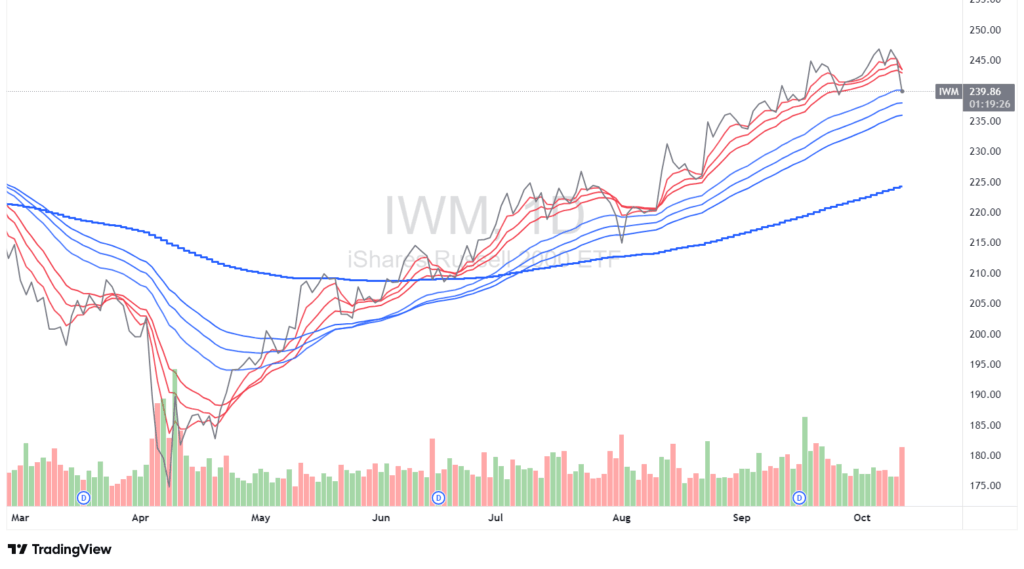
Source: TradingView
EAFE (International/non-US)
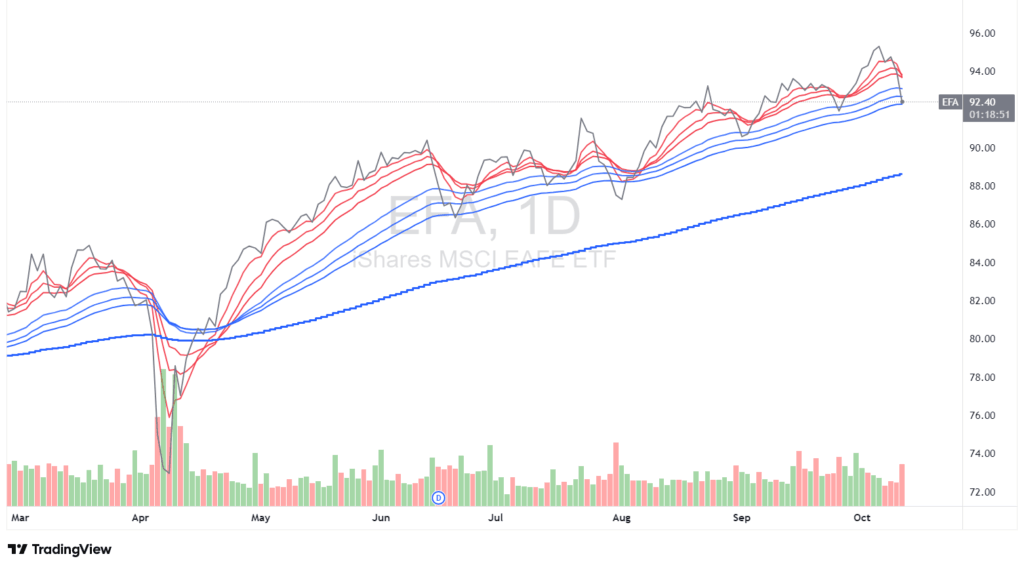
Source: TradingView
Gold
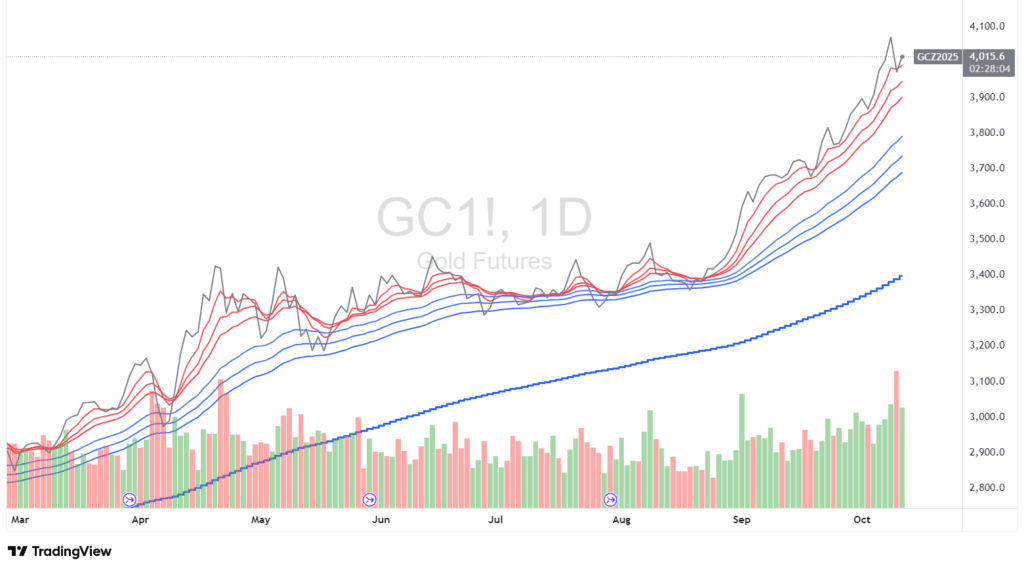
Source: TradingView
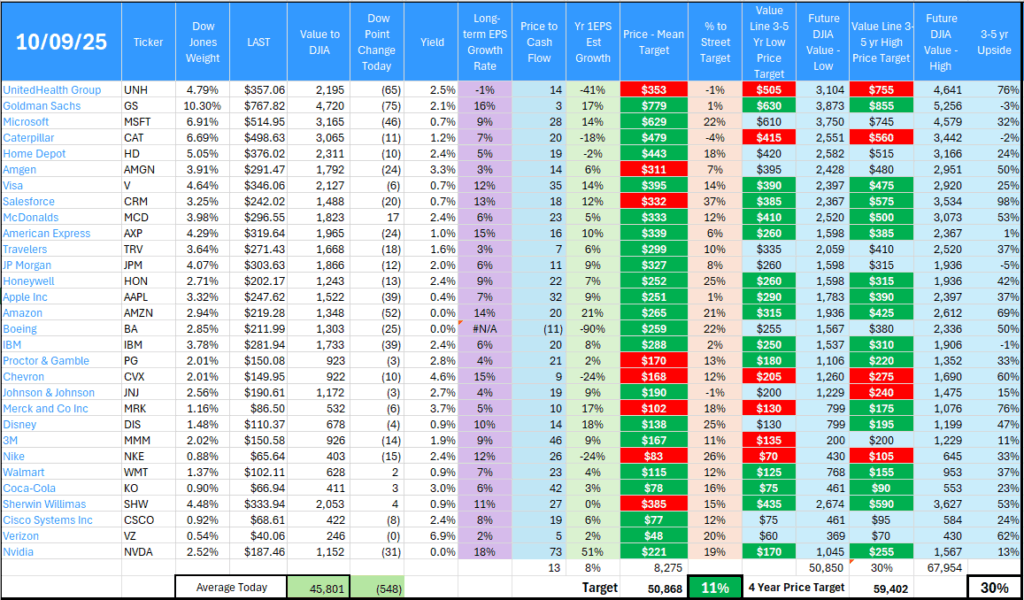
Our long-term model for the Dow Jones Industrial Average can help guide us as it helps us determine the potential upside for the Dow. If our model suggests only a 5% return in 1 year, we will likely reduce our exposure to stocks because the typical downside at any given moment is usually 10% or more. If you can make 5% in a year but your downside is 10%, that’s not a favorable risk/reward ratio.
These are just some of the tools we use in addition to what we believe is good old fashioned fundamental research. The bottom line is that in our opinion, your chances for good investment performance are better when the trend is up and big investors are buying stocks.
Data Source: TradingView, FactSet, calculations USAM
We believe investing today requires a customized financial plan integrated with a well thought out investment approach. If you have questions about how to invest or which investments may make sense for you, schedule an appointment by clicking this link or contact us today at david.cross@us-am.com or 678-894-0697.
Important Notes: The Standard & Poor’s 500 (S&P 500) is an unmanaged group of securities considered to be representative of the stock market in general. The Russell 2000 index is an index measuring the performance of approximately 2,000 smallest-cap American companies in the Russell 3000 Index, which is made up of 3,000 of the largest U.S. stocks. It is a market-cap weighted index. The term, “Nasdaq” is also used to refer to the Nasdaq Composite, an index of more than 3,000 stocks listed on the Nasdaq exchange that includes the world’s foremost technology and biotech giants. Indexes are unmanaged and do not incur management fees, costs, or expenses. It is not possible to invest directly in an index.

David.Cross@us-am.com