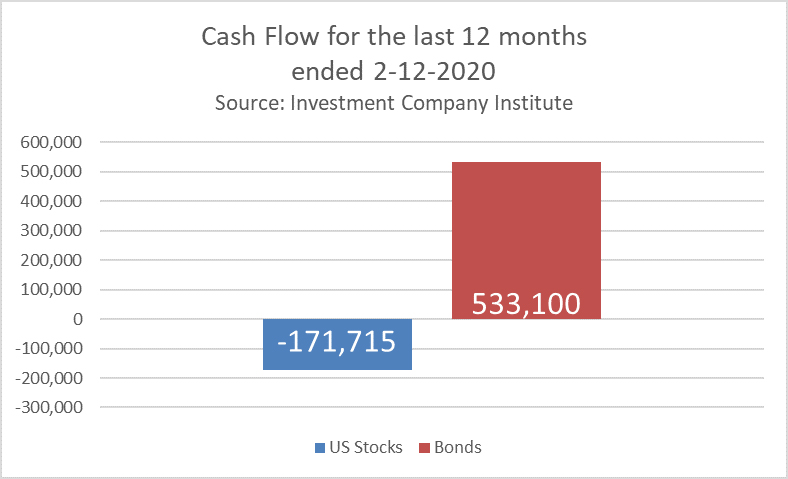
Over the last 12 months, investors have continued to sell stocks and buy bonds with $171 billion leaving stocks and over half a trillion going into bonds. In my 30 years of experience, stock markets can be volatile at times, but stock markets usually don’t top when people are nervous. Markets tend to top when everybody is in stocks. That is simply not the case right now.

How often do market drops like this happen?
About twice each decade since the 1960’s and the worst ones usually coincide with recessions or major changes with global issues. According to Yardeni Research:
Since the beginning 1950, the S&P 500 has spent 7,135 calendar days (not to be confused with trading days) while in true correction status – i.e., a loss of 10% or more from a recent high. Having undergone 37 corrections, this works out to an average time from peak to trough of 192 days, or a touch over six months.
In fact, of the 37 stock market corrections the S&P 500 has undergone, 23 of them have lasted 104 or fewer calendar days, with only three corrections lasting longer than this length over the past 36 years.
Of the 37 corrections, we have had 37 recoveries and gone on to higher highs.

David.Cross@us-am.com

