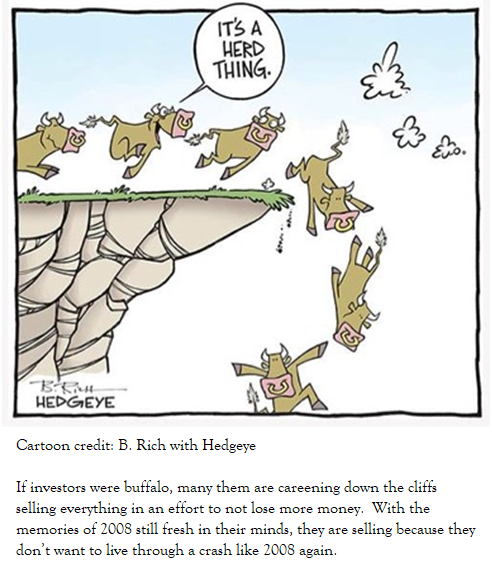
The herd is jumping off the cliff
A large part of my job as a portfolio manager is to appraise the value of companies. I buy them when I estimate that their stock price is below my appraised value and sell them when they are higher than my appraised value.
As you can see from the image below, the stock price (in red) jumps around while the appraised value is mostly stable. The daily stock price gyrations are a function of investor perceptions for the outlook of the company. If you have ever owned a business, you know the appraised value of your business does not gyrate wildly like a stock price and even if somebody quoted you a price every day, a rational person would ignore daily price information.
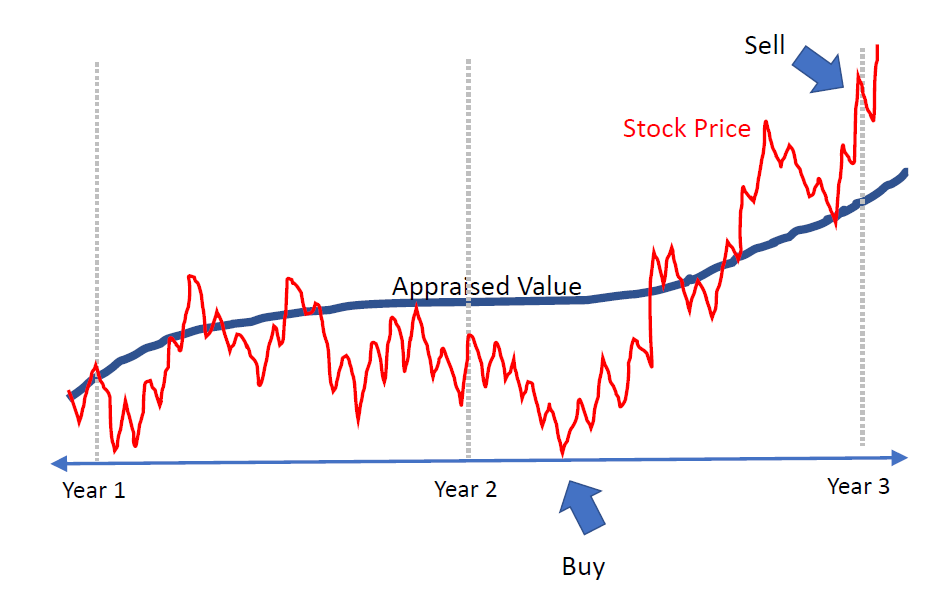
Source: U.S. Asset Management
Another part of my job is the role of behavioral psychologist – both for helping clients understand their own behavior and for understanding herd behavior in the market. Investors ride an emotional roller coaster that can be costly – if you make decisions along with the herd. To illustrate, consider the fact that during the 10 years ended December 2017, the S&P 500 had an average return of 8.5% while the average stock fund investor made 4.9% – (source Dalbar). The reason for the difference in returns is simple – investors tend to buy when they feel good and sell when they feel bad. Please notice the word “feel” used repeatedly here.
Right now, I think we are at the Capitulation point (the pinkish cloud) when investors feel regret for investing and you hear people say, “Maybe the markets just aren’t for me.”
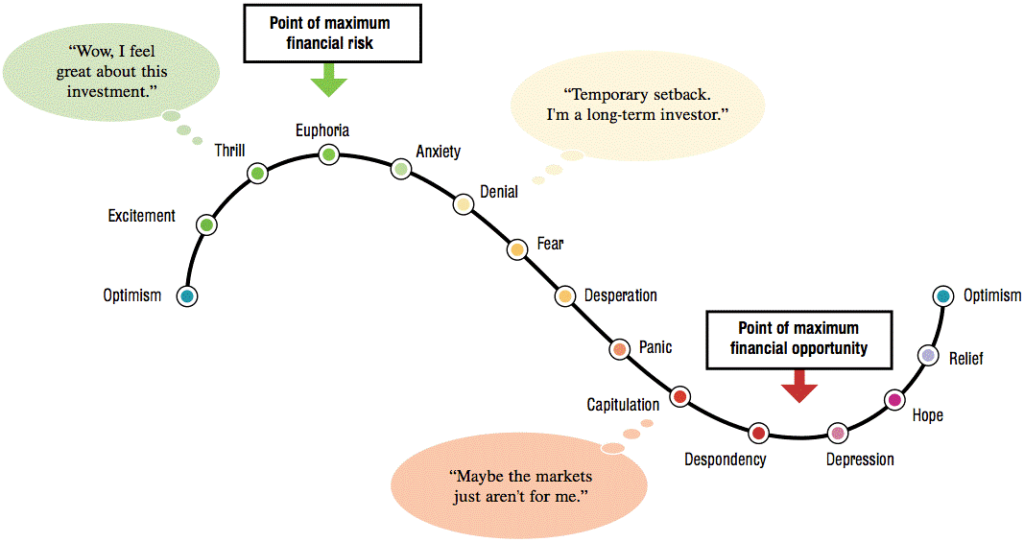
And, you feel worse when your investments go down because those bad feelings are reinforced by bad news everywhere, TV, internet, even the newspaper at Chick-fil-A! The bad news phenomenon is called Availability Bias because bad news is available everywhere, so you naturally think only bad things will happen to you. Franklin Templeton funds has a short video that explains Availability Bias if you want to learn more, click the picture below or click here. If not, read on.

What caused this sudden shift in sentiment?
In a word, uncertainty. Markets hate uncertainty and we have plenty of it – a trade war with China, Gross Domestic Product (GDP) growth is slowing from 4.4% to 2.9% (not declining, just slowing) source: Federal Reserve, the President wants to fire the Fed Chairman, the Fed is raising interest rates while withdrawing liquidity at the same time – that’s a procedural foul like offsides in football, not to mention the President wearing out his twitter account among other things.
If you give investors the ability to sell their investments when they feel a tiny bit of uncertainty, they will sell, and they will send the prices of company stocks well below their appraised value. Feelings are wonderful things when you are in love but a terrible tool for managing investments. It is best to use empirical data.
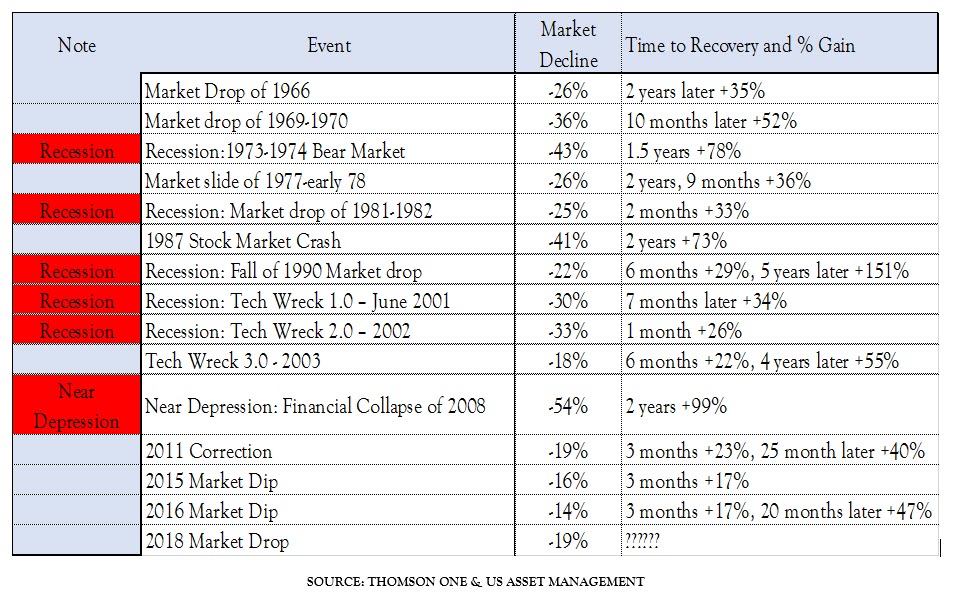
How often do market drops like this happen?
About twice each decade since the 1960’s and the worst ones usually coincide with recessions or major changes with global economic issues. So, the next logical questions are:
- Do we see a recession coming? No, not yet. The US economy is quite strong
- Do we see a major global economic issue unfolding? That is hard to tell. The closest issues we have are the Chinese Tariff / Trade War and Brexit (the British exit from the European Union) but both of those issues seem to have been accounted for because the Chinese stock market is down 30% from high this year and the EuroStoxx 50 is down 19%. (source: Bloomberg)
What’s the bottom line?
Our data suggest that many stocks are selling well below their appraised value. In my entire career, I have only seen mispricing like this once – March 2009. That’s when the Dow Jones Industrial Average was at 6,500. My model suggested that the Dow Jones Industrial Average was worth 10,000 in the coming 12 months or 53% higher. I was told that I was crazy and irresponsible for swapping out of cash and bonds and into stocks in March 2009 – but it worked and we did well.
We think the worst is now behind us and we would be investing idle cash right now. We think U.S. stocks could see excellent returns next year. Right now, my model indicates the potential for substantial gains in U.S. stocks particularly in Core and Value stocks, less so in growth stocks. Here is what our models suggest as of today (our numbers are updated daily, so this is just a snapshot for now.)
Dow Jones Industrial Average 28,474 or +27%
iShares Core S&P MidCap ETF 400 +32% (prospectus)
iShares Core S&P Small-Cap ETF +38% (prospectus)
It looks to me like Santa Claus delivered some nice opportunities, but they were disguised as homework!

David.Cross@us-am.com